In it’s simplest form, Expected Goals (xG) measures the chances of a shot resulting in a goal. It is done by crunching shot numbers from a dataset of historical data, often thousands and thousands of shots. There are numerous different models available and each model uses different variables to calculate the “value” of a shot. Some use just distance and angle, others include more information such as the type of shot, type of pass, foot vs header and number of defenders between the shooter and the goal. Once all this is taken into account, a percentage chance (on average) is given of that shot resulting in a goal. Here’s a video from Opta, one of the data collectors and providers.
A very simple model by Paul Riley can be viewed here. Paul took data from whoscored.com of Europe’s big 5 leagues and was able to make a model in less than 20 minutes. The xG of a shot is usually expressed as a decimal number between 0 and 1. For example, 0.34 means that a chance converts 34% of the time. A high value. Just to add to that, we took 8 seasons worth of shot data in the Top 5 European leagues (Premier League, La Liga, Bundesliga, Serie A & Ligue 1) and broke the xG of shots down into the following areas (with an xG value):
- 6-Yard Box (0.34)
- 18-Yard Box (0.12)
- Outside the Box (0.03)
So on average, a shot taken from within the 18-Yard box has a 12% conversion rate – one in around every 8 shots results in a goal. Outside the box that converts to 1 in 33 attempts. We know there are already flaws to this method but bear with us (skip to the end link for criticisms).
Let’s put it into action with data from the 2017/18 PSL season. Match Day 9 saw Kaizer Chiefs play a scoreless draw with Orlando Pirates. Included is the shot numbers and the xG chart:
Team Shots 6-Yard Box 18-Yard Box Outside Box
Kaizer Chiefs 14 0 9 5
Orlando Pirates 15 0 4 11
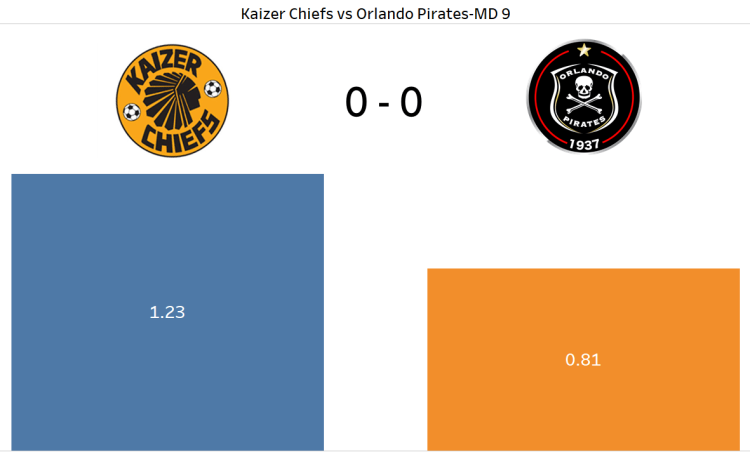
The image above shows the xG of the match. Chiefs scored a theoretical 1.23 xG against Pirates’ 0.81. Based on this, it is apparent that Chiefs should have won the game around 1-0 on account of the higher shot count but also the greater value of “high” quality shots. Having said that, we do not encourage to take single xG games at face value. The variability of a single game is massive and a team (or the teams in this case) could have been highly unlucky with their conversion on the day. Or the keepers had worldies.
After all, results in football can often be down to luck or randomness. One team can create lots of chances but not score and one team needs only one chance and scores on the day. Being able to sustain that, though, is highly unlikely and xG gives us an opportunity to see the teams brought back to earth – or they continue until their bad luck runs dry. Over a period of time xG allows us to gain an insight into a team.
Let’s take Bidvest Wits as an example. Half-way into the 2017/18 season, they had played 15 games and had the highest difference from actual goals (7) to xG (16.87) – along with Platinum Stars. In layman’s terms, Wits were at a deficit of 10 goals by the time of the Christmas break.
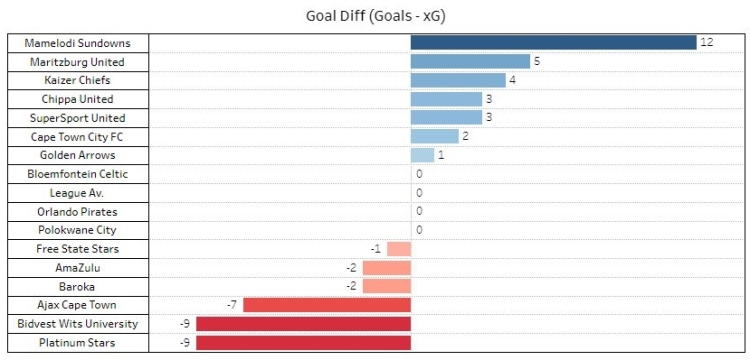
To make matters more difficult for the club, they were top in shots taken, and not only were these taken good locations but they were also hitting the target at a steady rate. Either the shots were terribly executed or they had incredibly bad luck in front of goal. At the time, Wits were in a relegation fight instead of sitting comfortably mid-table (where they finished the season).
Criticism of xG
More about judging team and player performances, as well as the criticism of xG, can be found in the lower half of this article.
